Passenger Distributions
Passenger Distributions have two uses:
- Specify how arriving
passengers (alighters and stayers) are distributed across the Carriages of a
Train Service.
- These are generally defined in the Platform-Train Interface worksheet of the Data Template. See Service in PTI High Level Objects and Create Distribution in PTI Data Template Setting.
- Specify where departing
passengers will be distributed along a Platform while awaiting their Train
Service.
- These are generally defined in the Platform Entry Distributions worksheet of the Data Template. See Platform in PTI High Level Objects and Platform Entry Distributions in PTI Data Template Setting.
Passenger Distributions for Train Services
When used in Train Services, Passenger Distributions dictate the relative proportions of passenger populations in each Carriage of a Train. For instance, alighters can be considered separately from stayers, on a per-Carriage basis.
Each distribution indicates the percentage of arrival demand applied to each Carriage.
Passenger Distributions for Platforms
When used with Platforms, Passenger Distributions allow Platform waiting patterns to be tailored to match either existing reality or expected use cases. For instance, passengers entering a Platform may be more likely to remain closer to the Entry Point, and less likely to wait further away.

Passenger Distributions for Platforms only apply over the lengths of their Services’ Trains, starting from their Services’ offset points (see Platform-Service Pairing for more information). Consequently, they must be defined according to distance from Service start, rather than distance from entry point.
In this example, the Service start is 50 metres forward of the Platform Entry point:
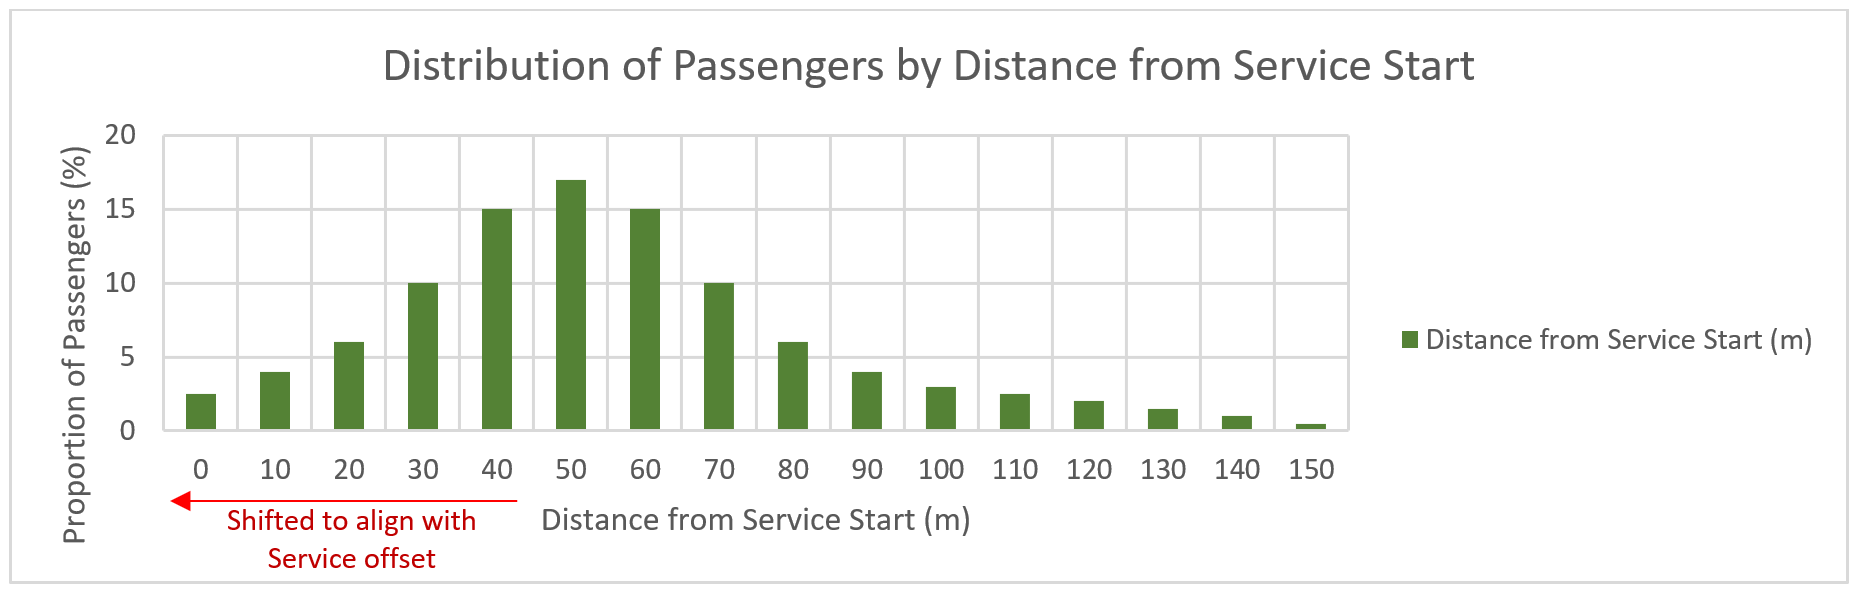
Since the number of bins in a Passenger Distribution usually matches the number of Carriages in the associated Service, e.g., 8 Carriages means 8 histogram bins, the distribution can be resampled to match:

- The original distribution resampled so the number of histogram bins matches the number of Carriages.
Assumptions made here are:
Platform, Service and Passenger Distribution Alignment
The positions of Carriages and Platform waiting areas are determined by a Service’s location relative to the Platform. Three attributes control this positioning:
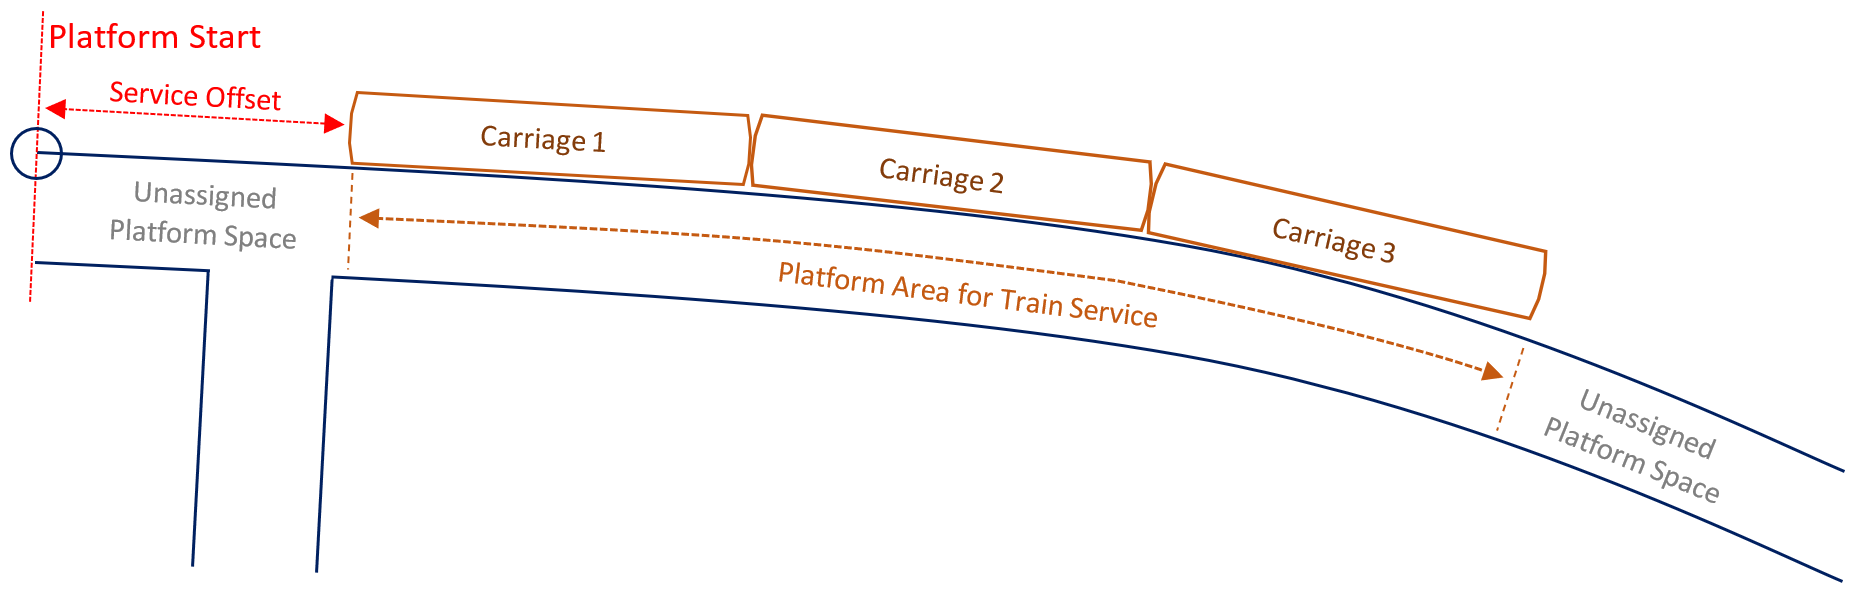
Entities for the Service can only wait in the Platform area adjacent to where their Train will be. Platform space before and after a specific Service location is unassigned, although:
- Entities for any Service may traverse such spaces to reach their waiting area.
- Other Passenger Distributions for different Services may assign Entities to those spaces.
A Passenger Distribution is assigned to the Platform and Service, and the passenger waiting area for that Service is split into sections of equal length. The number of sections is the number of histogram bins in the Passenger Distribution.
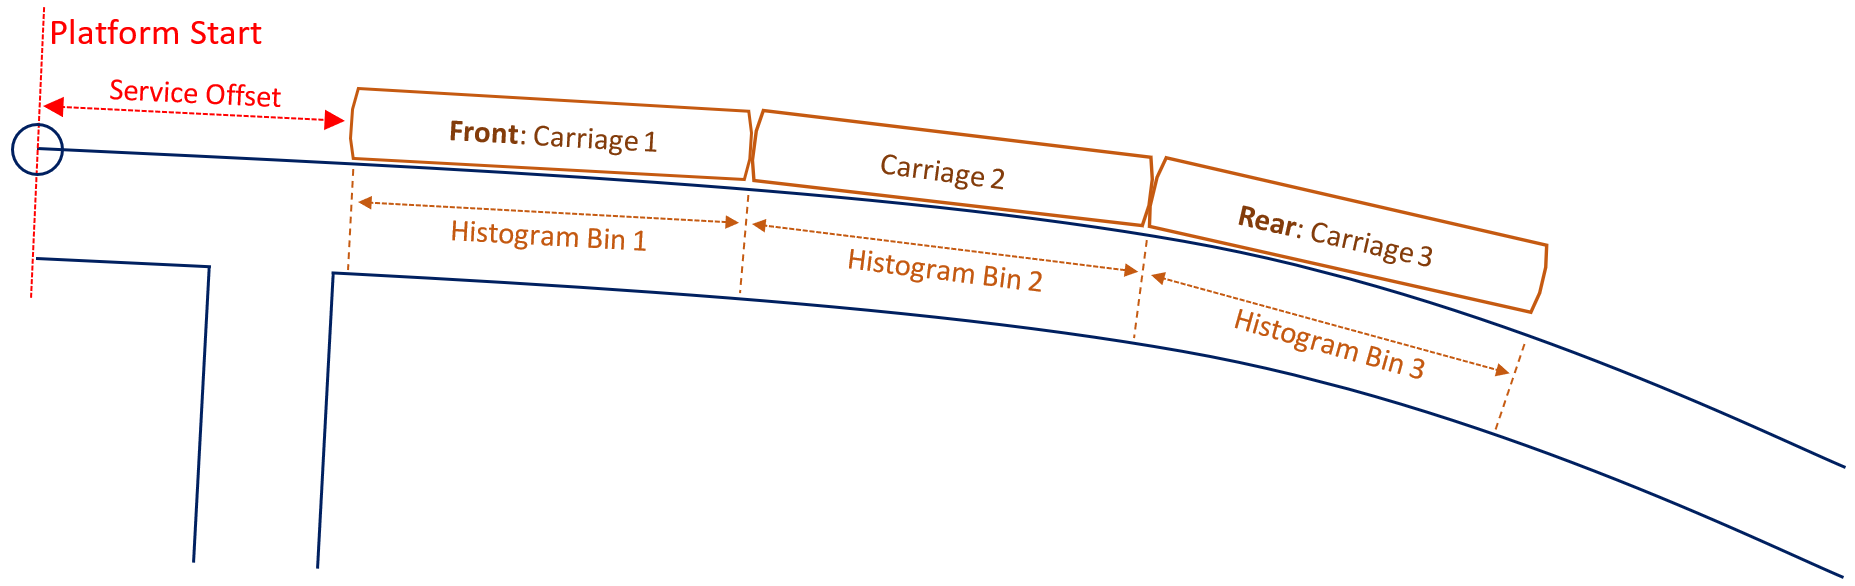
- Entities’ waiting areas for a Service with three Carriages.
- A Passenger Distribution, with three histogram bins, is applied across the Platform area spanned by the orange arrows.
- Entities for this Service only wait in these Platform areas.

Reversed Train Configurations
When a Service uses a reversed Train, Platform Passenger Distributions are applied in the opposite direction.

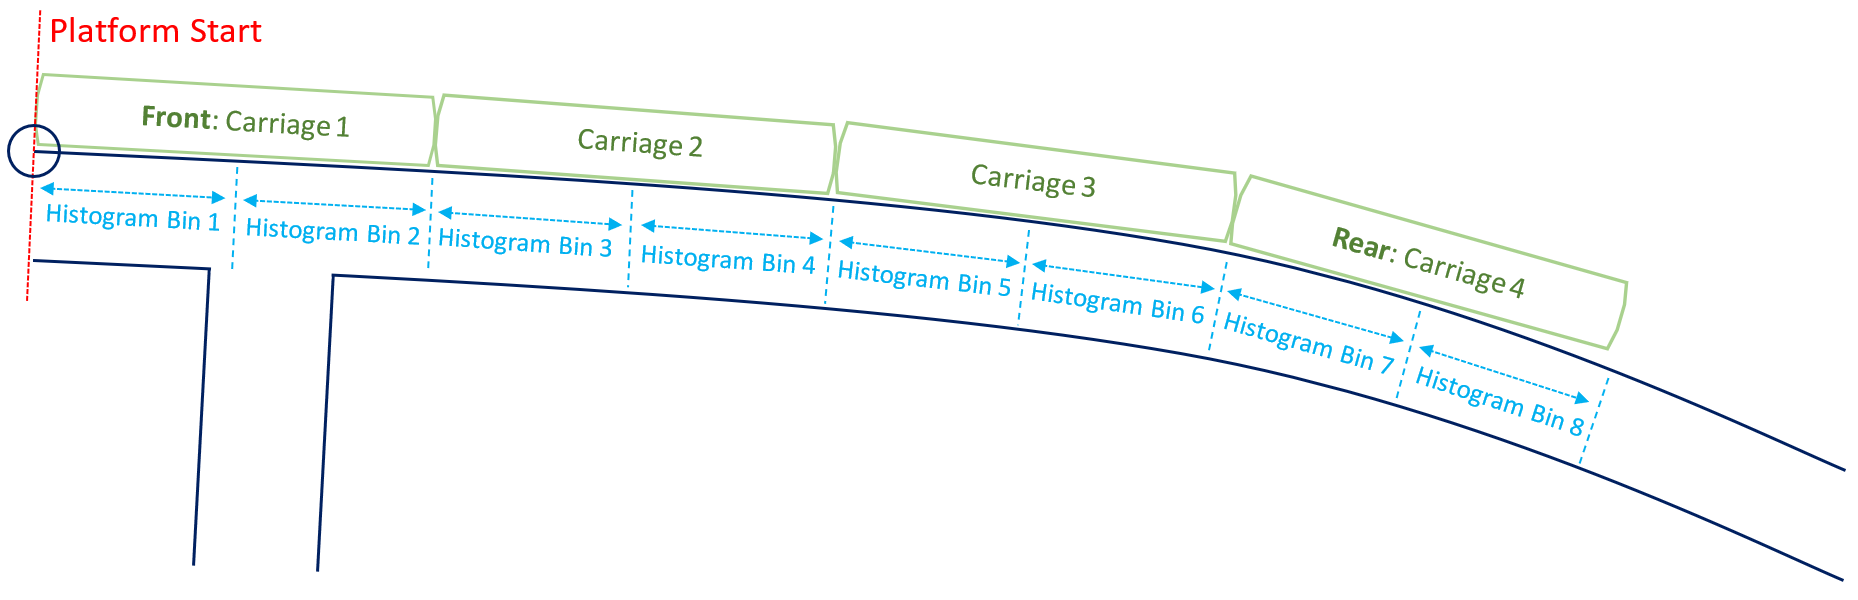
When Distributions are Not Aligned with Carriages
Histogram bins don’t need to perfectly align with Carriages. LEGION Simulator calculates the correct distributions for each Carriage and Platform waiting area, even when there are fewer, or more histogram bins than Carriages.
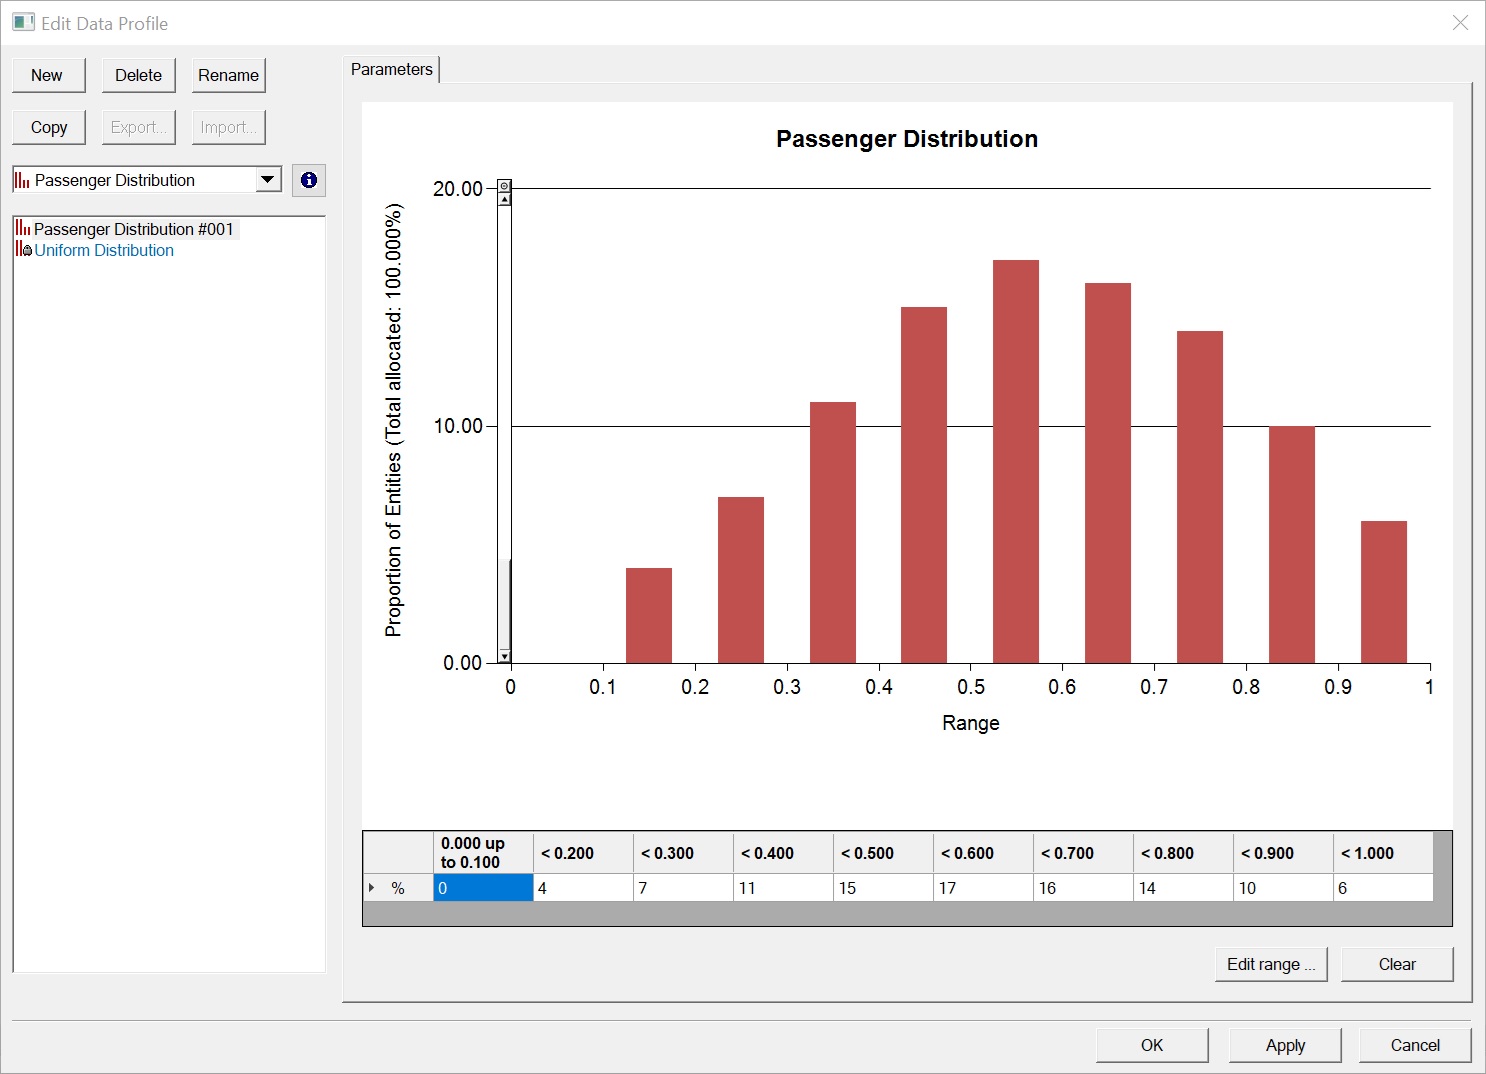
Creating a Passenger Distribution
While we recommend that users define their data in LEGION Data Template, customised Passenger Distributions can also be specified in the Edit Data dialog box in LEGION Model Builder.
The same process applies to both the Train Service and Platform use cases.
To create a User-defined Passenger Distribution:
- Click
 or select Data > Data
Profiles.
or select Data > Data
Profiles.
- From the drop-down list on the left of the dialog box, select Passenger Distribution.
- Click the New button in the top left-hand corner.
- Enter a meaningful name in the highlighted 'name' field.
- Select the number of histogram bins by clicking the Edit Range… button and entering the new number:
- Adjust the values in the
histogram by clicking on the vertical bars and dragging them upwards or
downwards.
- If you'd like to drag the bar in increments of 0.01% rather than 1%, hold down the <Ctrl> key as you drag.
- Alternatively, adjust the values by clicking into a data cell at the foot of a column and entering values directly. Press <tab> or click into another cell to apply this data.
- If at any point you wish to clear and reset these values, click the Clear button.
- Click Apply or OK to save the Passenger Distribution.

Any Passenger Distributions you create will be available to you when creating Services, Platforms and Platform Entry Zones.